
In the summer of 2020, Cotiviti released a new health risk map to help determine which states might see serious, medically attended novel coronavirus (COVID-19) cases. At the time, we were interested in measuring the impact of underlying conditions on different stages of coronavirus clinical progression, especially the end stage of mortality. After considering the publicly available data on infection rates and the well-researched effects of comorbid conditions on mortality rates, we shifted our attention to the middle of the clinical progression path, including ambulatory, emergency, and inpatient care. These areas provide the best actionable insights to understand and prevent clinical progression toward death.
To study this area, we looked to understand which groups were more likely to not just be infected, but also require some form of medical attention after infection. We quantified this association by measuring the rates of COVID-19 medical care for various demographics and calculating a relative risk score for different groups. The relative risk measures the risk faced by one group relative to the risk faced by a separate group. In our study, we compared the relative risk of contracting a case of COVID-19 necessitating medical intervention among people with underlying conditions relative to those without. It is important to note we are not measuring the relative risk of death due to an underlying condition, nor are we measuring the relative risk of infection alone; rather, we are measuring the relative risk of infection requiring medical attention.
Since the type of underlying condition can play a role in a person’s susceptibility to COVID-19, we considered the following chronic conditions that can exacerbate symptoms after infection: cardiovascular disease (including hypertension), type I and type II diabetes, chronic kidney disease, liver disease, chronic obstructive pulmonary disease, emphysema, and asthma.
In our earlier maps, we noticed that people who had any one of these comorbid conditions were more likely to be medically attended for COVID-19. However, with each successive update to our map, we started to see a counterintuitive trend: those with an underlying condition appeared less likely to contract COVID-19 and require care. This finding surprised us, so we began to dig deeper into our data and compared our findings with research and literature related to COVID-19.
We uncovered three important findings:
- Medically attended COVID-19 cases appear to be less prevalent among senior Americans.
- Relative risk appears to have shifted from those with underlying conditions to those without.
- The impact of age should not be underestimated when assessing the relative risk of contracting medically attended COVID-19 given an underlying condition.
Changing age groups impacted by COVID-19
Between mid-January and late May, the Centers for Disease Control and Prevention (CDC) reported the incidence for COVID-19 cases was highest among individuals 80 years and older at 902 cases per 100,000. The next highest incidence rates were observed in the 50-59 and 40-49 age groups, with an incidence 550.5 cases per 100,000 and 541.6 cases per 100,000, respectively.
When summer arrived, there was a significant demographic shift in new COVID-19 cases. During June through August, people in the 20-29 age group had the highest incidence of COVID-19 infections, which accounted for more than 20% of all confirmed cases. When the southern United States grappled with several outbreaks, adults aged 20-39 were responsible for most of the COVID-19 cases, which then led to increased infections– by four to 15 days–among adults 60 and older.
Since our data is exploring COVID-19 cases cumulatively—February 2020 through early December 2020—we visualized our COVID-19 case distribution by age group and compared it with the CDC’s distribution (Figure 1).
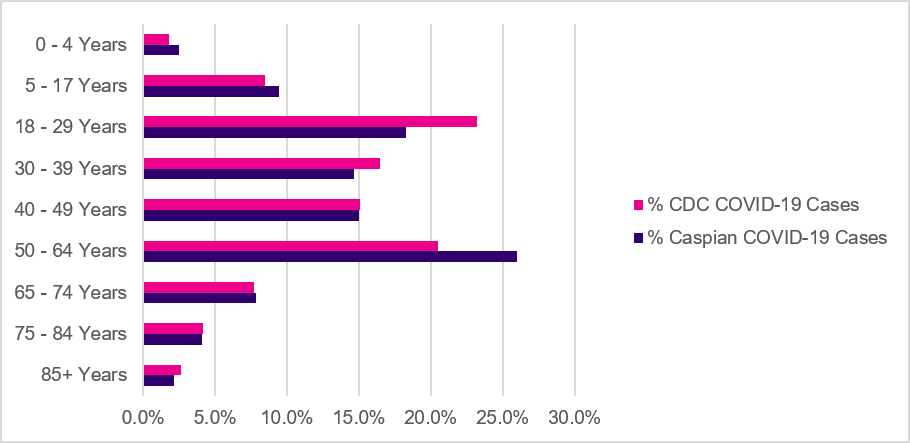
Figure 1. Age distribution of Caspian and CDC confirmed COVID-19 cases.
Cotiviti’s data comprising approximately 1.2 million COVID-19 cases, pulled from our Caspian Clarity data and analytics ecosystem (Caspian), shows a similar demographic distribution relative to the CDC’s 15 million COVID-19 cases. However, there are two notable exceptions, the 18–29 and 50–64 age groups. Caspian appears to have a larger pool of older adults requiring medical attention for COVID-19, whereas the CDC shows the largest pool of people infected with COVID-19 to date are those between 18-29.
It is important to note that the CDC is reporting its cases based on those who have had a positive test result. Cotiviti’s data, on the other hand, is measuring diagnosed COVID-19 infections based on medical intervention. This is further in the clinical progression than those who test positive for COVID-19, which includes many patients who are asymptomatic and may never present to a medical facility.
People without underlying conditions appear to be infected at a higher rate for medically attended COVID-19
In Caspian, after controlling for age, the rate of COVID-19 infections without an underlying condition now appears to be consistently higher compared to the rate of infections among people with underlying conditions (Figure 2).
Surveys that explore attitudes and behaviors around COVID-19 may explain the higher COVID-19 caseloads in otherwise healthy people. A survey on voluntary compliance to public health measures conducted by faculty from Boise State University found that respondents over 40 were more likely to adhere to public health guidelines, such as not leaving the house except for an emergency, following state and federal regulations, and washing hands, compared to respondents under 40. Given the wealth of information and research on older adults’ vulnerability to COVID-19—most of whom are also likely to have at least one of the underlying conditions in our map—it’s not unusual to observe the higher compliance rates to public health recommendations in this age group.
In a separate survey on public attitudes and behaviors related to COVID-19 published by the CDC, over 90% of older adults ages 55–64 and seniors 65 and older were more likely to agree that people should keep at least six feet of physical distance. Furthermore, 83% of older adults and 87% of seniors also believed that groups of 10 or more persons should not be allowed. In contrast, 74% of late adolescents ages 18-24 and 82% of young adults ages 25-34 agreed that people should keep at least six feet of physical distance. In addition, 71% of late adolescents and 80% of young adults believed that groups of 10 or more persons should not be allowed.
The lower percentages of agreeing with social distancing measures among young people could be attributed to a false sense of confidence in young adults’ perception of being less vulnerable to COVID-19. These beliefs may be linked to early reports that COVID-19 impacted older adults and seniors more severely than younger adults. While young adults are less likely to get hospitalized or die from COVID-19, some can still develop serious complications and long-term symptoms, especially if they are living with diabetes, hypertension, or obesity. Furthermore, younger adults are more likely to work in service-oriented industries, such as in restaurants, bars, and in retail stores, where their exposure risk is higher.
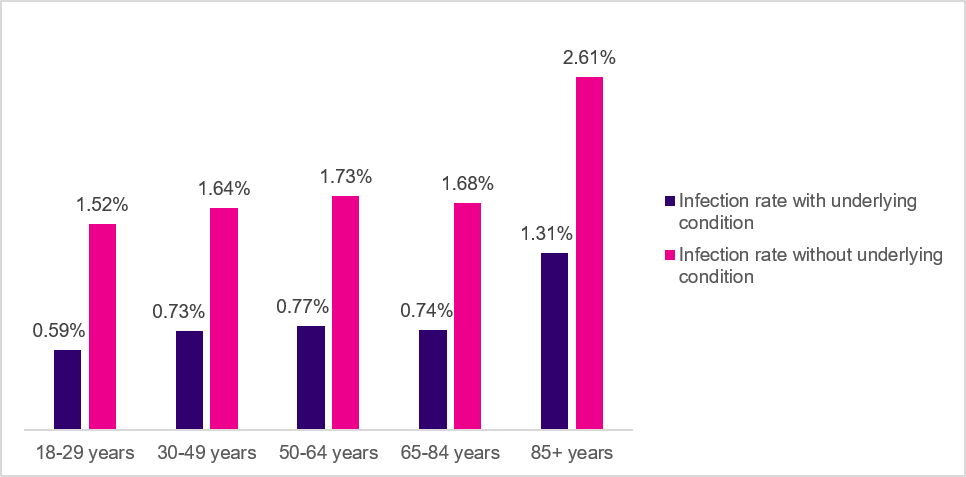
Figure 2. COVID-19 infection rates by age group (Caspian data).
For some states, age appears to impact the degree of reduced risk of contracting COVID-19
Despite this counterintuitive pattern among people with comorbid conditions and their relative risk of contracting COVID-19, age appears to function as an “effect modifier” for some states, where people 85 and older had the lowest degree of reduced risk. Effect modification is a phenomenon where the magnitude of the effect of the exposure variable (having a comorbid condition) on the outcome (contracting COVID-19) differs based on the level of a third variable, such as age.
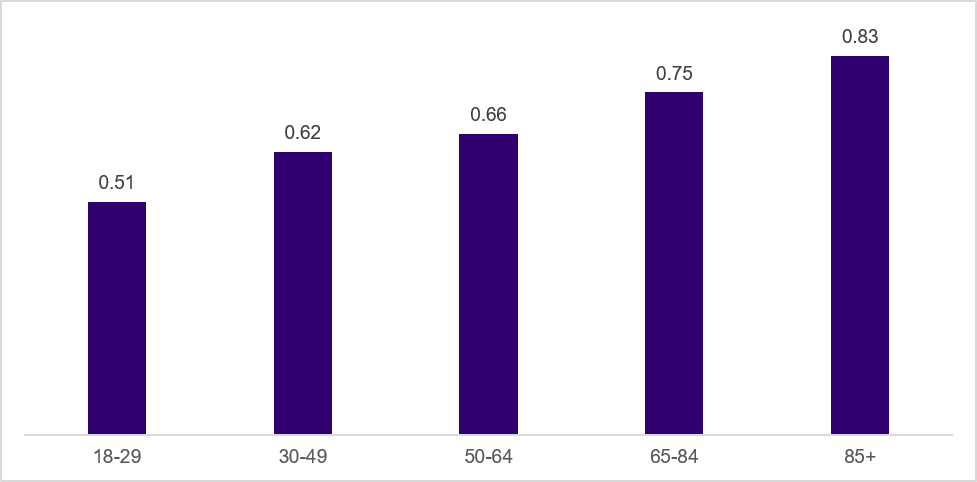
Figure 3. New York relative risk scores by age group (Caspian data).
After controlling for age, states such as New York (Figure 3) and Massachusetts had a gradual increase across age groups in their relative risk of contracting COVID-19 given the presence of an underlying condition, which appears consistent with literature regarding advanced age and risk of serious COVID-19 infection. Moreover, older age and frailty are significant risk factors for COVID-19 mortality. Other states, such as Texas (Figure 4), had the opposite trajectory, where people in the 18-29 and 30-49 age groups had lower degrees of risk reduction compared to people 85 and older.
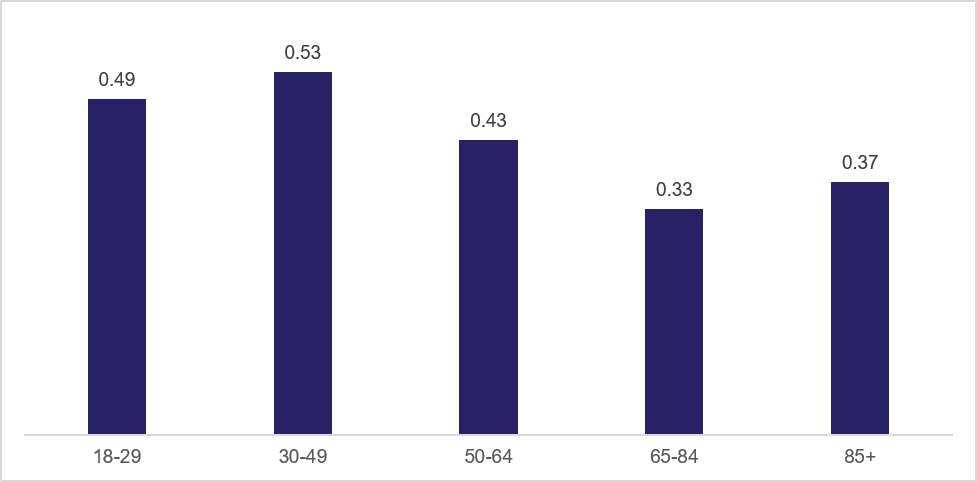
Figure 4. Texas relative risk scores by age group (Caspian data).
These patterns could be attributable to the level of COVID-19 testing conducted in each state. States with high positive test rates may only be testing the sickest patients who are seeking medical attention, while states with lower positive test rates are casting a wider net. As of January 3, 2021, New York and Massachusetts have positivity rates below 10%, while Texas has a positivity rate of 18.3%.
Key caveats to our sample of COVID-19 cases
Although our map has highlighted an interesting trend where people with underlying conditions are potentially less likely to contract COVID-19 requiring medical attention, there are several important caveats we need to consider:
- Our health risk tracker considers only the eight chronic conditions listed above and does not include other diseases that can impact the risk of COVID-19 infection such as obesity, cancer, or other immunosuppressive disorders.
- The relative risk of medically attended COVID-19, regardless of comorbidity status and age, could be higher among the uninsured. According to the Kaiser Family Foundation, there were nearly 28 million non-elderly adults living in the United States in 2018 who lacked health insurance. Many of these uninsured adults work in service-oriented occupations, which increase their risk of exposure to the virus. In addition, about 5.1 million adults who are uninsured are at high risk of serious illness from COVID-19.
- Cotiviti data, available for permissible use in this study, represents nearly half of the 92% of Americans that have some form of health insurance coverage in the United States and is only representative of people who have health insurance. Insurance coverage mix in our data is mostly private health insurance and Medicare, which may affect the reporting of more adults between 50-64 receiving medical attention for COVID-19.
- People with health insurance, especially with a commercial or Medicare Advantage plan, could have a greater ability to socially distance, compared to people who may be on Medicaid. Medicare beneficiaries are more likely to be retired and may be able to shelter in-place. Similarly, those with commercial health insurance could be working in occupations that enable them to work from home.
- Because our data is exploring medically attended COVID-19 cases, it likely does not include those who are voluntarily getting tested for COVID-19. In order to have a COVID-19 test be covered by insurance, the test must be deemed medically appropriate by a healthcare provider.
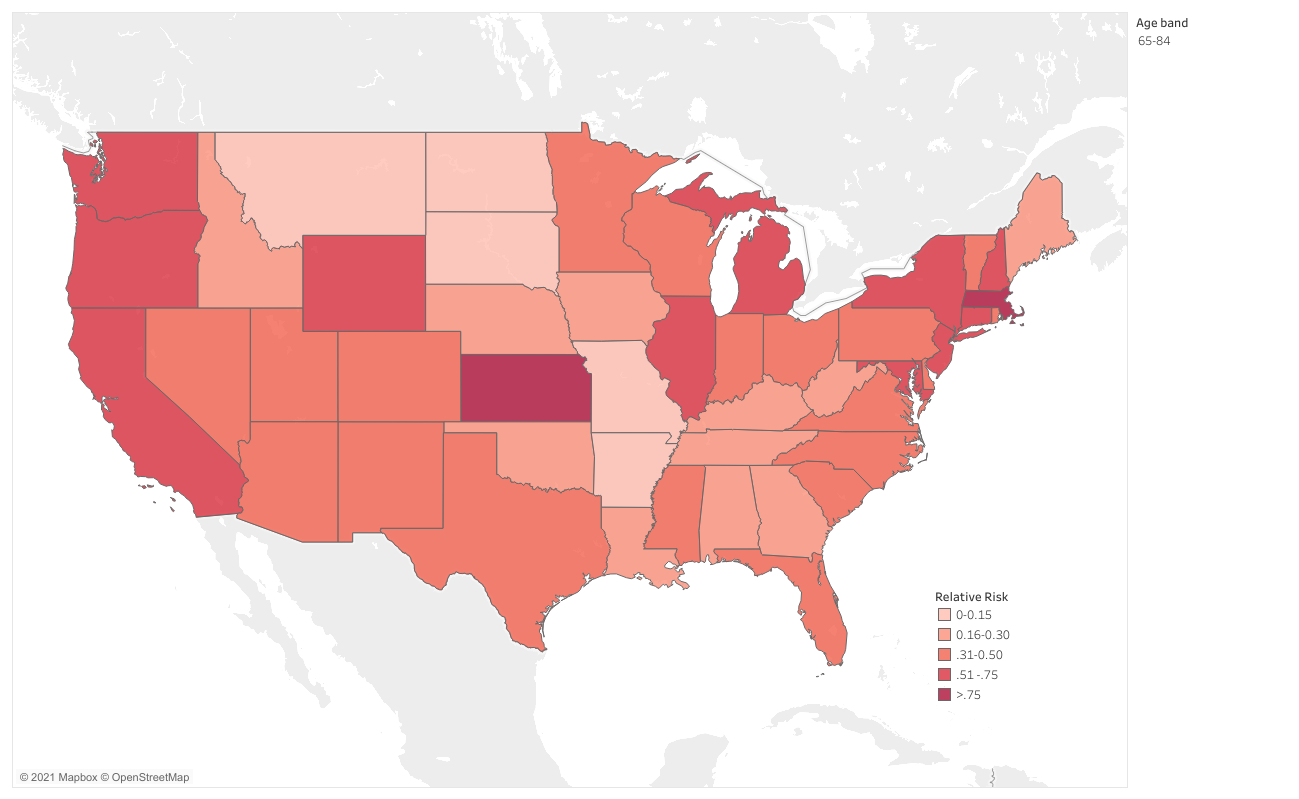
Figure 5. Cotiviti Health Risk Tracker map (January 2021). Click to view full map.
Takeaways for all healthcare stakeholders
Cotiviti’s latest findings have uncovered a counterintuitive pattern where people with underlying conditions now appear to be less likely to contract COVID-19 requiring medical intervention, relative to people who may not have any underlying conditions.
Considering that people worldwide have been living through this pandemic for a year, and given the abundance of information available on adverse outcomes from COVID-19 for people with underlying conditions, it’s possible our latest map reflects adaptive behaviors among vulnerable populations, which may be playing a role in their risk reduction. However, continued adherence to public health guidelines is needed in younger age groups, as these cohorts comprise a significant portion of positive COVID-19 cases and may be able to transmit the virus more easily than others. Continued adoption of non-pharmaceutical interventions such as wearing a mask, maintaining at least six feet of distance from other people, and washing hands will help slow the spread of COVID-19, especially as vaccine distribution widens and the risk of becoming complacent grows.
As demonstrated by our updated Health Risk Tracker map (Figure 5), states with higher relative risk scores for the elderly and those with comorbid conditions have more work to do to protect their most vulnerable populations. These states would benefit from further reinforcement of social distancing practices to reduce risk. While it may be tempting to believe the end of the pandemic is in sight as certain populations begin to receive a vaccination, policymakers and individuals should not grow lax in their efforts to reduce infection spread as much as possible.